
Conversion tracking monitoring is a daily reconciliation between actions that happened in the business and the matching events accepted by your measurement destinations. Count approved orders or valid leads from the system of record. Compare that number with the corresponding tracking event using an identical reporting window and accepted status. The percentage gap is your loss signal. Server request logs then show where the missing events stopped.
Tracking can die silently. We found one setup that had worked for two years until someone uninstalled the WordPress plugin responsible for inserting its tracking code. The website stayed online. Ads kept spending. In another account, audience lists stopped filling for months because an access token had expired. Nobody learned about either failure from a platform alert. They learned after the business result and the tracked result had already drifted apart.
The prevention is small compared with the repair: one daily count, one gap calculation, a sensible threshold, and outgoing request evidence you can inspect while it still exists.
Why does conversion tracking fail silently?
Conversion tracking fails silently because every component can remain healthy from its own point of view. WordPress serves the page after a plugin disappears. A tag manager workspace remains published even when its snippet is gone. A server container can receive requests while one destination rejects its tag. Everything looks normal. The ad account can keep spending against an old audience even though the list behind it has stopped growing, and none of those systems knows the business expected a specific event count today. The missing expectation is the monitor. It must sit outside the delivery path and compare what the business recorded with what tracking received. Otherwise, zero events may look like a quiet day. A green container status may hide rejected requests. A token can expire without breaking the page a customer sees. The failure becomes visible only when someone notices a reporting gap, often weeks later.
This is also why a one-time QA checklist ages badly. It proves the implementation at that moment. It says nothing about tomorrow’s plugin cleanup, consent release, domain change, token rotation, template update, or webhook edit.
How do you check conversion tracking every day?
Start with one event that can be counted outside the advertising and analytics stack. For ecommerce, use approved orders after excluding the payment states your business rejects. Start there. A lead operation can use valid form submissions or the CRM records created by that form, as long as the definition stays fixed across both counts. Then count the matching event received by each destination. Keep the comparison operational: Purchase receipts against approved purchases, or Lead receipts against accepted leads. Campaign-attributed conversions are a different measure because attribution windows, click matching, view-through rules, and reporting delays change the total. Run the job after both sources have had time to settle, save the daily result, and compare it with the account’s own baseline. One table is enough to start.
| Field | Business side | Tracking side |
|---|---|---|
| Unit | Approved order or valid lead | Matching event receipt |
| Window | One defined reporting window and zone | The identical reporting window and zone |
| Status | The business state you accept as real | Accepted or successful event delivery |
| Identity | Order ID, lead ID, or another opaque record ID | The same ID when the destination supports it |
| Question | How many real actions happened? | How many matching events arrived? |
Save raw counts as well as the percentage. Ten missing events out of 1,000 and one missing event out of two tell very different operational stories.
How do you calculate tracking loss percentage?
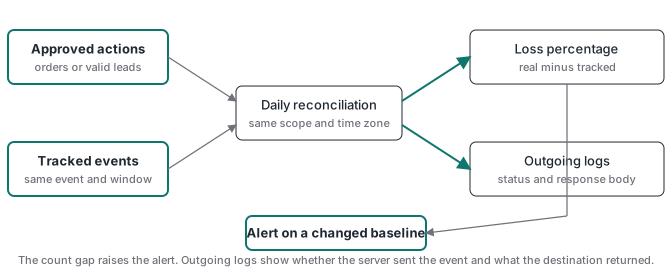
Use the business count as the denominator: (real actions - tracked events) / real actions × 100. If the ledger has 100 approved orders and the destination accepted 92 Purchase events, the measured loss is 8%. Keep the signed result. A result below zero means tracked events exceeded real actions, which points toward duplicate firing, retries without idempotency, test traffic, or a wider event definition. When real actions equal zero, the percentage is undefined. Record the counts and wait for activity. Two zeros are not proof of health because the source itself may also be broken. Add an independent activity check such as checkout sessions, form loads, or total server requests so the monitor can distinguish a quiet day from a dead pipeline. For accounts with little volume, calculate the metric daily but evaluate the alert on a rolling seven-day window.
Don’t borrow a universal acceptable percentage. Consent, browser loss, event rules, payment states, and destination processing differ by setup. Measure a clean baseline for this account, document why the remaining gap exists, and alert when the pattern changes.
What alert rules catch a real tracking failure?
A useful rule needs a denominator, a baseline, and a delay that matches the operation. Alerting whenever one event is missing makes a low-volume account noisy. Alerting only when the count reaches zero misses partial loss. A practical rule might require at least 20 approved actions, a loss above 10%, and two consecutive daily breaches. Those numbers only illustrate the rule. Set them from the normal range you observed for the account. Add separate checks for a complete outage, an unexpected negative gap, stale credentials, and a customer list that has stopped growing despite eligible new records. Include the account, event, window, both counts, gap, last success, and relevant release in the alert. That gives the person on call somewhere concrete to begin.
Watch provisional data too. A monitor that waits several days for a settled report protects the monthly dashboard but leaves today’s spend exposed. Keep a daily provisional lane for the most recent complete day, then a settled lane that recomputes the same date after late events have arrived. The first warns. The second confirms.
How do outgoing request logs expose expired tokens and rejected events?
Outgoing logs separate a server tag that fired from a destination that accepted its request. In server-side GTM Preview, Google lets you inspect the tag that generated an outgoing request and the full response returned by the destination. Preview is excellent for a controlled test, but it is a live diagnostic session. Persistent logs are what help after an alert arrives at 8 a.m. for a failure that began overnight. On Stape, enable Outgoing request logging in the container’s Logs area. Its Logs documentation says the view can be filtered by date and destination, and that enabling outgoing logs also enables Monitoring when the plan supports it. Supported tags can expose status codes and response bodies, so an expired token often appears as a run of authorization responses instead of a mysterious drop in audience size.
Logging coverage depends on the tag template and host. Stape documents outgoing logs for supported Stape tags, while a separate logger or warehouse export may be needed for other templates. Google’s server container debug guide remains the controlled test for inspecting an outgoing HTTP request and its response. Store a trace ID, event name, destination, timestamp, response status, and a bounded response body. Avoid retaining raw personal data that the diagnosis does not need. Limit access and set a retention period.
A 2xx response proves that an endpoint accepted the HTTP request. It does not prove the destination counted the conversion, matched it to a person, or attributed it to a campaign. Finish at the destination’s own test or diagnostics view. The sGTM debug ladder uses the same receipt-by-receipt approach from browser route through server claim and destination report.
What should you do when the loss alert fires?
Follow the event in order and stop at the first missing receipt. Confirm the business count first. Then open the public page outside an administrator session and verify that the expected container or script is still present. Reproduce one event, inspect the browser request, and check whether it reaches the server hostname. In the server container, confirm that a client claimed it, the right tag fired, and an outgoing request exists. Read the destination response. Finally, confirm the event in the destination’s own test view. Changing several layers at once destroys the evidence and can add duplicates while you repair a loss.
Use this incident order:
- Confirm that real orders or leads exist in the expected business state.
- Check the live website installation and its recent plugin, deploy, consent, or cache changes.
- Trace one controlled browser request all the way into the server container and save its host plus trace ID.
- Inspect the matching outgoing request. Read its status and response body.
- Check token expiry, permissions, destination identifiers, and the endpoint configuration that produced that response.
- Verify destination receipt, then reconcile the controlled event by its order or lead ID.
- Record the cause and repair. Save the release time and first successful event after the fix as the recovery receipt.
If the alert points to ordinary browser loss instead of a new break, compare the browser and server routes before changing anything. The event recovery guide explains how to measure those routes without turning one account’s result into a universal promise. Building the route itself? The Meta Conversions API with GTM guide covers the server route and deduplication, then shows the destination check.
Build monitoring into the implementation
A tracking setup is unfinished until someone can tell whether it still works. Add the source count, event receipt, gap calculation, freshness check, credential owner, and outgoing-log location to the handoff. Schedule the comparison daily. Test the alert by creating a controlled failure in a safe environment, then prove it clears after recovery. That small exercise tells you whether the monitor watches the real pipeline or a dashboard that can fail alongside it.
Advanced Tracking Academy gives media buyers reusable web and server GTM containers for verified conversion flows, plus the implementation guidance to test each receipt. See the ATA setup for media buyers if you want the container and monitoring pattern ready for client work instead of rebuilding the same controls on every account.